- To: visad-list@xxxxxxxxxxxxx
- Subject: two-color isosurface
- From: Stuart Wier <wier@xxxxxxxxxxxxxxxx>
- Date: Thu, 24 Aug 2000 13:05:06 -0600
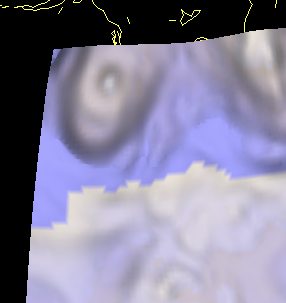
When plotting a surface in a 3D FlatField with
ScalarMap of RealType mapped to Display.IsoContour,
and with a custom color table in the color control,
the surface sometimes shows two colors, though the
surface is for one single value and should have
the corresponding single color.  Example attached.
What's happening?

Stu Wier
Unidata Program Center
UCAR
P.O. Box 3000
Boulder, CO 80307

Unidata home page: http://www.unidata.ucar.edu/
- Follow-Ups:
- Re: two-color isosurface
- From: From: Bill Hibbard <hibbard@xxxxxxxxxxxxxxxxx>
- Re: two-color isosurface