- To: "gembud@xxxxxxxxxxxxxxxx" <gembud@xxxxxxxxxxxxxxxx>
- Subject: [gembud] Question regarding gdplot3 contour scale
- From: Mark Hughes <themarkca@xxxxxxxxxxx>
- Date: Thu, 4 Aug 2016 20:17:30 +0000
Hi All,


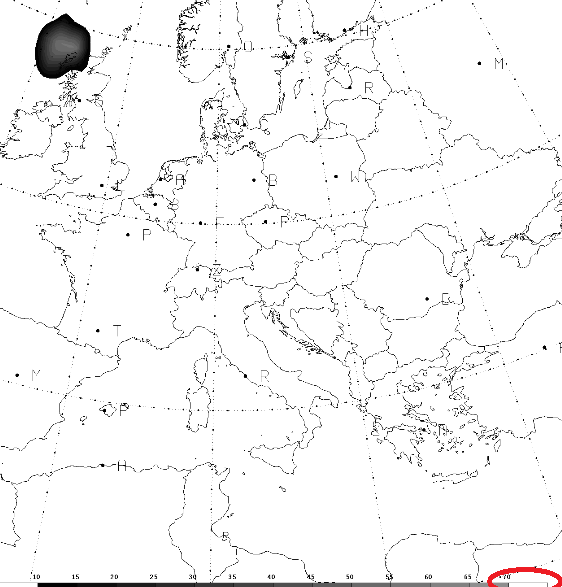
I am contouring GRIB2 data (ICING) and gdplot3 is producing a scale ("color
bar") for a filled contour which shows an unexpected value.


The attached image scaleProblem1.PNG has a red circle around the problem.  The
highest value in the field is 56.  The gradient in the color bar shows a white
box for the range 60-70.  I would expect the next grayscale value in FLINE.


The parameter FINT is:

    5/10/70

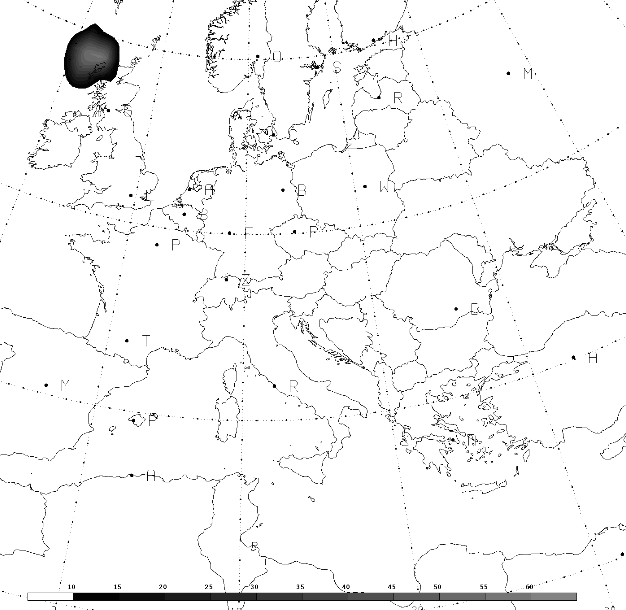
The attachment scaleProblem2.PNG shows that the chart looks OK if I change FINT:

    5/10/60

However, the maximum value could be above 60.


I would greatly appreciate any suggestions.


Mark Hughes, Frequentis CA
Attachment:
scaleProblem1.PNG
Description: scaleProblem1.PNG
Attachment:
scaleProblem2.PNG
Description: scaleProblem2.PNG
- Follow-Ups:
- Re: [gembud] Question regarding gdplot3 contour scale
- From: Michael James
- Re: [gembud] Question regarding gdplot3 contour scale
- From: Devin Eyre
- Re: [gembud] Question regarding gdplot3 contour scale